.png)
Do you believe in patterns? Or, more precisely, what we would call cognitive pattern recognition? That is, in the idea that you can derive meaning from data or symbols that seem innocuous or irrelevant at first until you start to see more and more similar patterns? Whether or not there is some inherent meaning is actually a moot point. What really matters is when data comes together to form a clear narrative you can identify, interpret, and act upon.
Data scientists, business intelligence analysts, and researchers are not the only ones trying to bring deeper meaning from data to the surface. In the world of cybersecurity, we search for meaning, too, in our daily efforts to foil highly sophisticated cyber attacks. But we cannot do this without the bigger threat picture. Since threats today have evolved well beyond what we can recognize as signature-based, or known threats, we now need a way to map and navigate a broader picture of the “unknown unknowns” — that is, of the once under-the-radar threats that at first glance may seem to be harmless or meaningless.
Now, with the launch of IronDome’s Detection Correlation Dashboard (DCD), we have the technology to map this threatscape visually, with the situational context necessary for knowing the severity level and behavior of each threat. Often these threats are the covert marks of cyber adversaries working undetected in our networks. Once you can share these contextualized, visualized patterns (e.g., lateral movement, malicious DNS tunneling) across a community of companies, organizations, states, and even nations, you have the ability to respond and defend more quickly and on a larger scale.
That is the vision and mission of IronNet’s Collective Defense, and it has come to life graphically in our new dashboard.
Fine tuning cyber threat detection and interpretation
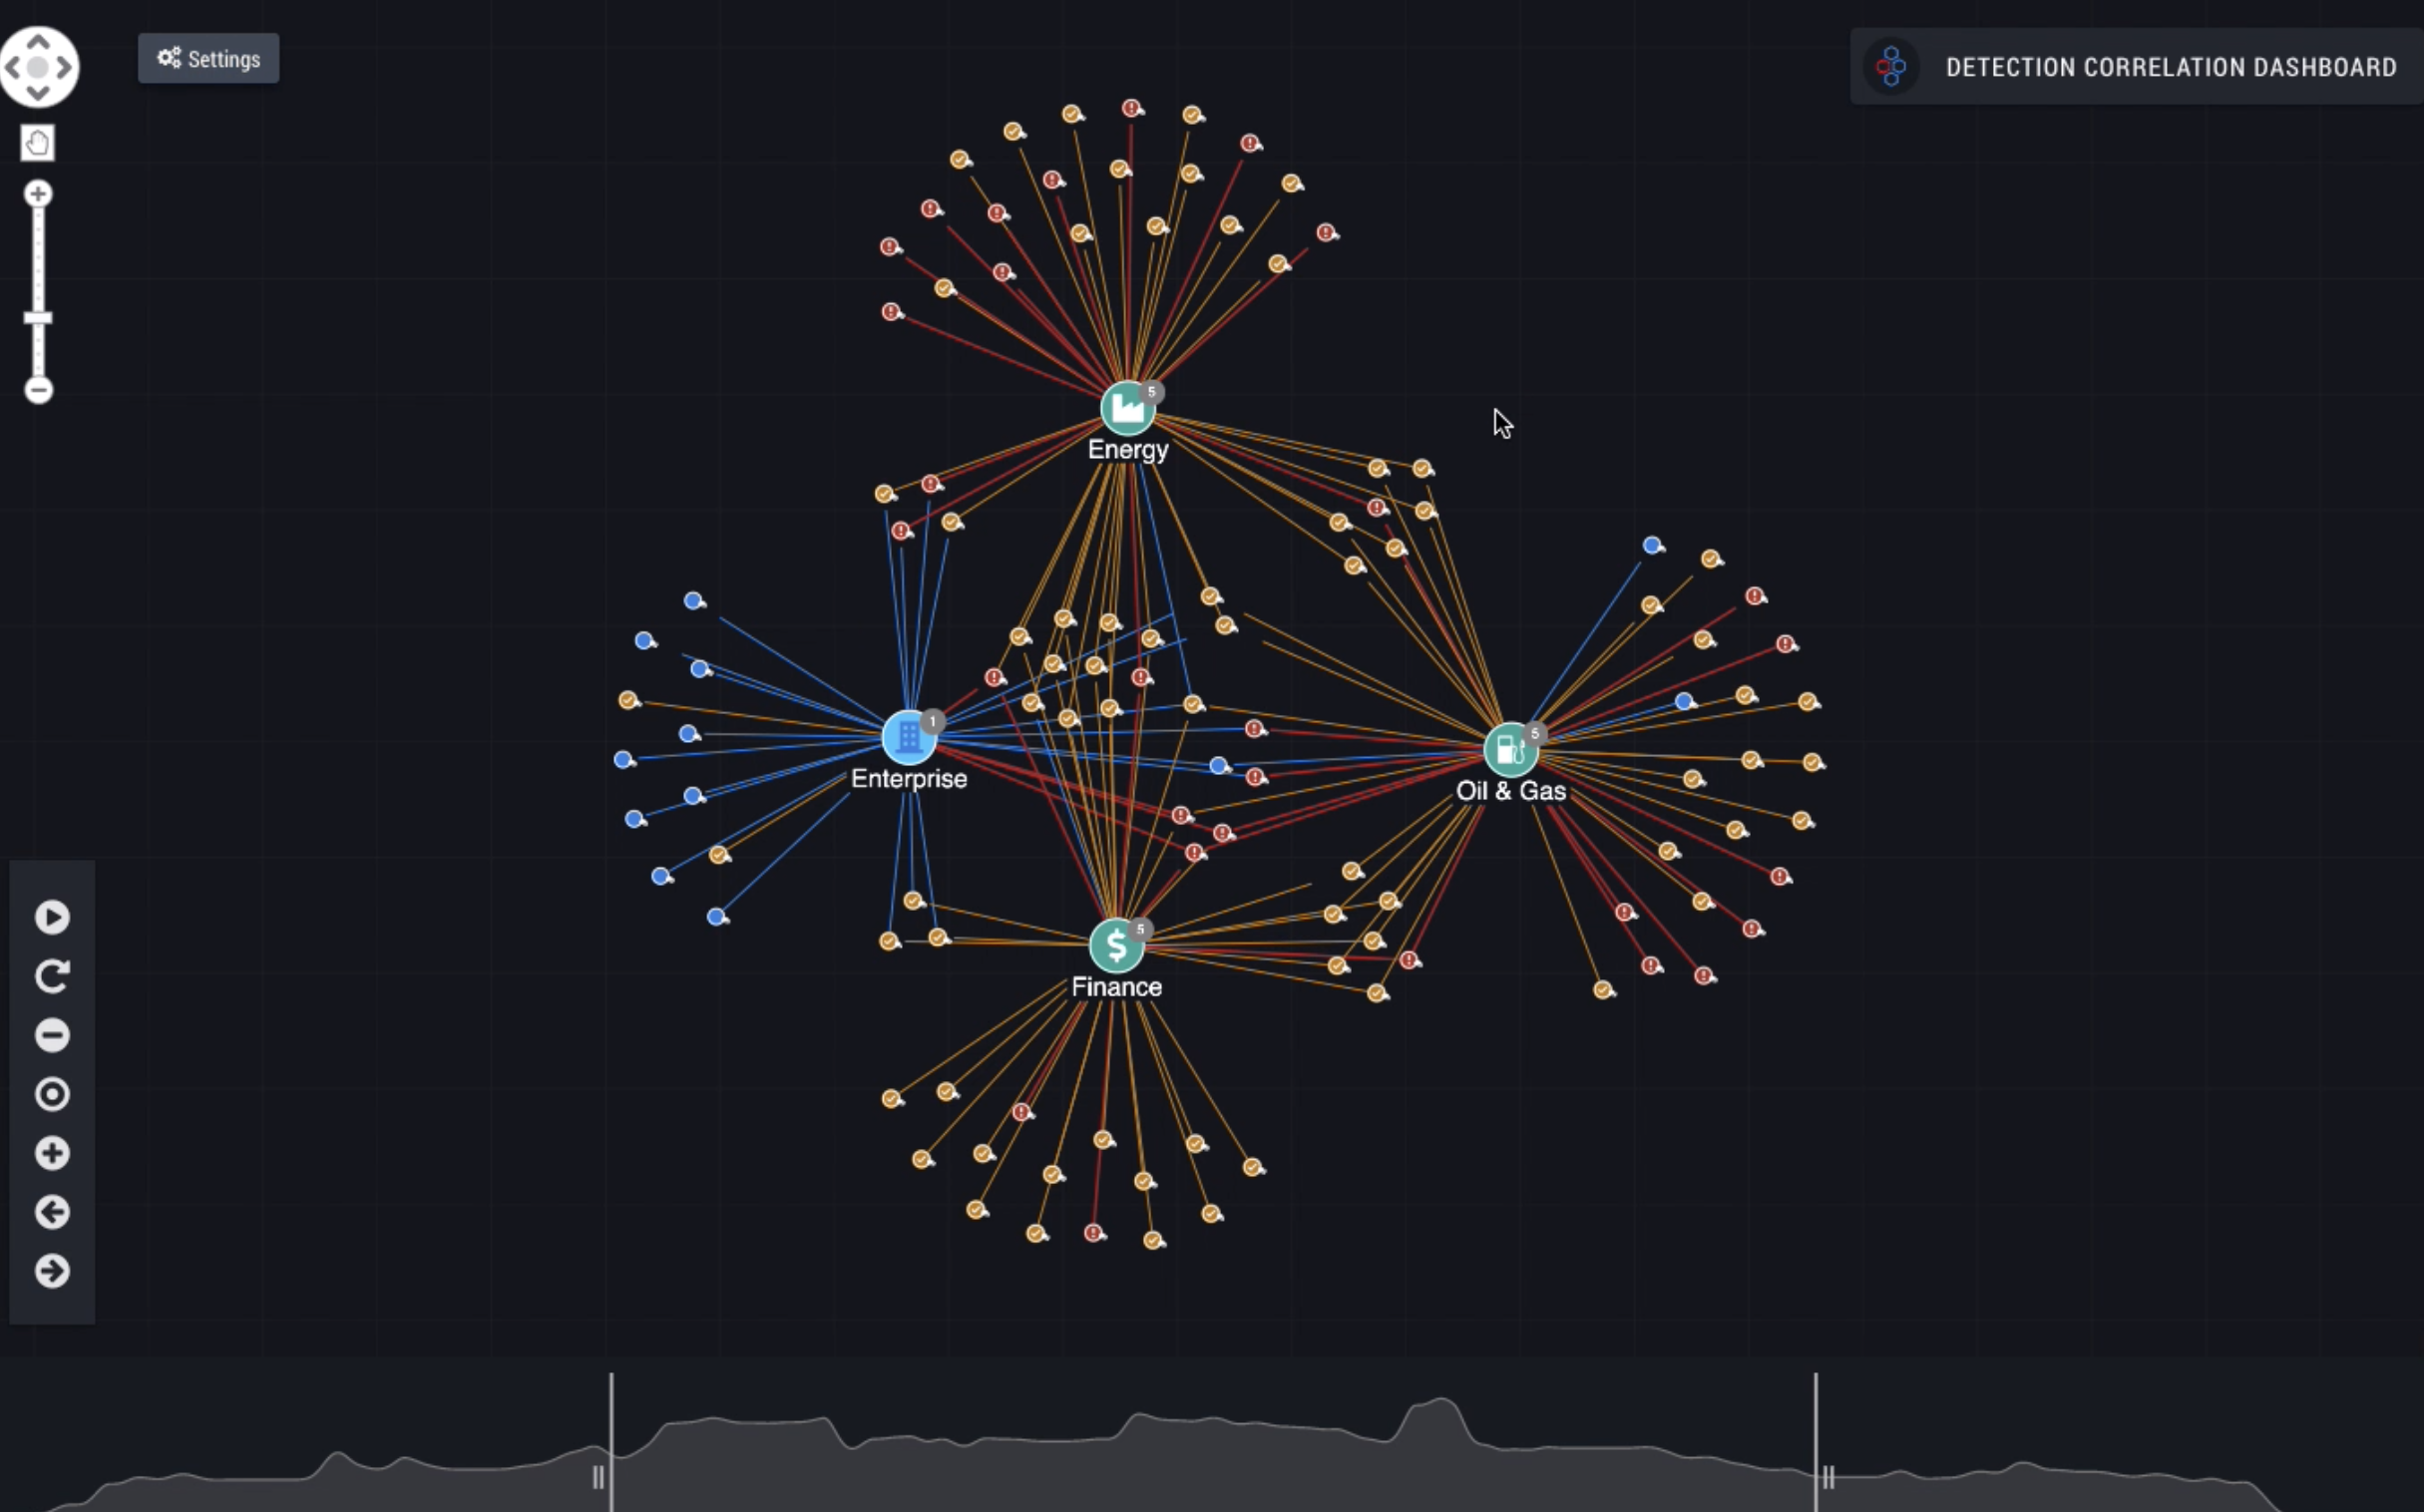
This dashboard shows how Collective Defense accelerates cyber threat detection and interpretation by cybersecurity analysts.
As you can see, the visualization maps the threats, which can be seen in multiple communities, thereby indicating greater meaning when correlated across the ecosystem. Here, the ability to share threat information is transformative, as this is how cybersecurity teams across participating organizations in IronDome communities learn from threats that affect every member, improving mitigation prioritization and efficiency for all. Consider the ripple effect that results from more accurate and timely threat intelligence: a proactive and collective defense.
Highlighting the key patterns and bad characters
Visualization is essential. Displaying alerts graphically instead of as a simple text list quickly shows all threat detections and suspicious behaviors with significantly more contextual information to enable better prioritization.
Each alert contains an identifier and, with analyst help, it could include ratings, alert type, context information, and other commentary. This example highlights one of the major hurdles in cybersecurity. Each of these alerts is automatically created based on anomalous network behavior, but the key element of determining risk is the human factor. Combining contributions from the IronDome participant SOC analysts with the intelligence and experience of IronNet’s Cyber Operations Center renders an interactive threat map, shedding greater light on what is malicious and not just suspicious.
Think of this Collective Defense dashboard as the Reader’s Digest of cybersecurity. With the wisdom of the IronDome community of analysts and our advanced analytics working behind the scenes, you don’t have to read the 500-page book yourself. We are doing the heavy lifting for you without taking away your ability to understand the critical plot elements and main characters. At the same time, you have your “group work” teammates volunteering their own commentary and analysis of signs they may spot in their own networks, giving the community at large a much more solid understanding of the larger threat narrative. Even better, all of this happens automatically at machine speed.
Defending in isolation no more
Imagine the payoffs for your cybersecurity efforts, foremost of which is filling the cyber talent gap that plagues most individual companies or organizations. Analyzing each one of these alerts is time consuming and is limited by the size, experience, and efficiency of your cybersecurity team. One of the main benefits of IronDome is its unique ability to weed out what is anomalous but acceptable and, in turn, shift the focus to the truly malicious behavior and threats. You can see suspicious behavior that has been identified in peers’ networks through analysis of encrypted traffic data. What may not seem suspicious at first, especially if it hasn’t affected your network yet, shows up on your radar and therefore lets you see well beyond the horizon and plan accordingly.
With visualized Collective Defense, all SOC teams in the collective are empowered to become more proactive and productive with their time (e.g., triaging and prioritizing instead of filtering and curating data). Just as important, flagging only validated, qualified alerts in the dashboard reduces the SOC’s “alert fatigue.” Think of Moby Dick. Who cares about the tedious details of whale hunting? We just want to know what happens to Ishmael and how he survives the whale. Likewise in a time sensitive job such as threat hunting, often it is more than enough to focus on the key points so that you can quickly make a decision. The dashboard establishes curated, high-value, and reliable threat intelligence so you’re not left alone navigating a boundless sea where everything makes you jump.
Decreasing dwell time before threats can rise to the surface
The IronDome Detection Correlation Dashboard reduces threat dwell time by prioritizing threats based on community information, not just on the indicators and information from a single entity. In other words, correlation beyond traditional Indicators of Compromise (domains and IPs) is possible.
In this example we are looking at six companies from the oil and gas sector connected in a single IronDome. The Detection Correlation Dashboard shows where threats in these separate networks match. This visualization enriches the context and improves the accuracy of the alert rating, even before your own SOC team has time to analyze it. These overlapping threats get a higher alert rating so your team can focus on more dangerous network activity, decreasing dwell time and contamination of your enterprise. Looking at correlations between other companies in this Collective Defense ecosystem provides further insight. Matches like these show threats that are prevalent but not yet on your network, allowing your team to be proactive and guard against threats before they have a chance to do damage.
This visual mapping quickly shows the movement of threats over time, so you gain better visibility of what’s coming, enabling CISOs to identify risks and communicate more readily about these risks and, just as important, how to prioritize response.
Defending the industry at large
You can take this capability a step further by using the DCD to visualize the industry customers gathered into one community. This shows correlations across the industry as a whole. As a result, we collectively can raise the bar on cybersecurity across industries and sub-sectors.
With the Detection Correlation Dashboard, it is also possible to bring multiple sectors into the visualization. Bad actors do not stick to a single industry of course, so there’s value in looking at the threat landscape across sectors. This view can allow companies to learn from others about threats that are attacking multiple segments. Enriched by analyst feedback, this capability benefits a region or state, protecting the networks of all pieces of critical infrastructure. Adversaries will no longer have the advantage of reusing malware across sectors, and the level of effort to execute unique attacks for each target could cripple their efficiency and vastly reduce the impact.
Enterprises that are fragmented are also vulnerable because they don’t have singular visibility into all of their networks. This fragmentation may be caused by business transitions such as mergers, varied access to customer networks, or separately managed divisions or geographies. The DCD provides a simplified central view of threats facing your entire enterprise, without connecting these separate networks. As traffic patterns and malicious activity is identified, additional correlated attacks can be eliminated. The IronDome is the virtual connection — the critical thread of this narrative.
Assigning meaning to the unknown unknowns
Let’s take a closer look at how seemingly small signs gain meaning in the Detection Correlation Dashboard. Traditional Threat Intelligence Platforms (TIPs) usually rely on signature-based detection tools. For example, the TIP will identify only the suspicious domain or IP, which is then broadcast as a warning to its subscriber list. While helpful, the bad actor can immediately move the malicious activity to a new domain, setting up a continuous game of cat-and-mouse (or cybersecurity “whack-a-mole”).
IronDome has the unique ability to track and display network behavior correlations. This tracking indicates when the same malicious behavior is hiding behind multiple domains. Defending against the network behavior threat is far faster and more effective than setting up signature detection for each new malicious domain or IP. there is even deeper value through simplifying the task of signature management for IronDome members. IronNet’s advanced behavioral analytics identify unknown threats from known behavior, turning unknowns into knowns, and using these knowns to enable a faster defense.
Emerging victorious, together, in the great cyber race
This new interface intuitively and automatically animates malicious and suspicious cyber anomalies as soon they are detected and correlates them across all IronDome members. The IronDome Detection Correlation Dashboard amplifies SOC teams’ abilities, allowing them to see attacks that are targeting their community, prioritize the most urgent threats, understand how other security teams have responded, and optimize their defenses more proactively. No longer does anyone have to float alone in the vast cyber sea, wondering what’s lurking beneath the surface. The bigger picture of the threatscape is right within view and we have the strongest tools and talent to interpret its meaning at network speed — fast enough to outpace even the biggest adversaries.
Discover more in the IronDome demo.

